Lire cet article en Français ![]()
SAP BusinessObjects vs. Tableau

Where Did It All Begin?
SAP BusinessObjects vs. Tableau. Classic vs. modern. BI reporting vs. data visualization. Two solutions that are well-known in the Data Analytics world with both of them being in the top 3 BI solutions deployed by organizations, but also two solutions that don’t necessarily work for everyone. SAP BusinessObjects was one of the pioneering companies of the time when it was released in 1990. It tackled one of the big issues of finding data, making the data useful, and then being able to present it in an understandable way. It provided a BI reporting solution that everybody could use. Tableau on the other hand was founded 13 years later and pushed through the barriers with its data visualization software to help professionals make the best business decisions thanks to its modern BI approach. So, you’re probably now asking yourselves: Which is the better solution? Should I be using both solutions? Well, we will try to give you some of the answers in this blog post.
Ding-Ding-Ding: Let The Battle Commence
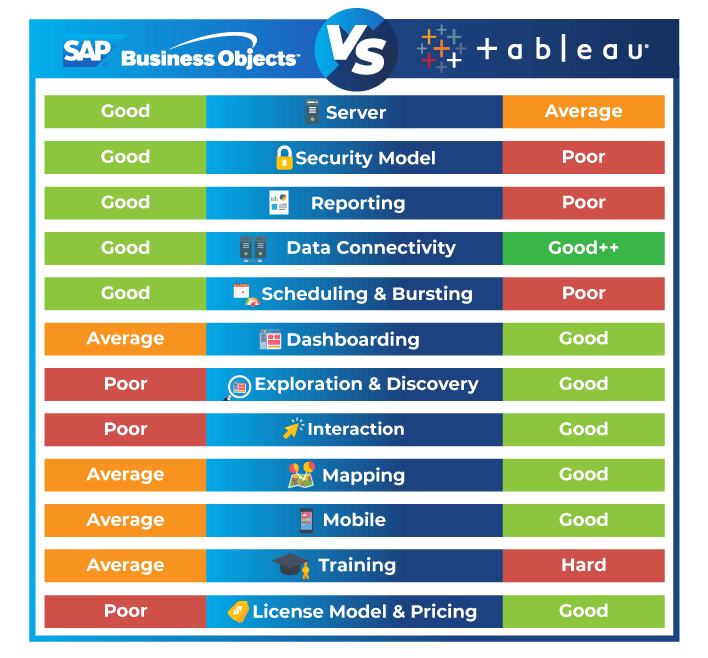
There is no perfect BI solution (I’d love to know if there is one!), each solution, like SAP BusinessObjects or Tableau, will win in certain aspects but not in the others. What’s important to understand is how far can you go with each solution and which one will eventually get ahead. Let us kick-off the battle with round one!

Server
SAP BusinessObjects has the strongest server by far, and you can make it as complex as you want it to be. Tableau on the other hand is more recent and so, can’t go as far as BOBJ in terms of the architecture and is not as mature as BOBJ. For example, if you restart your Tableau server, you’ll have to wait about 10 minutes which is still 4-5 times longer than BOBJ before being able to do anything. Tableau has also only recently introduced clustering whereas this has been available in BOBJ for a lot longer. First strike for SAP BusinessObjects I’d say!
Security Model
Tableau allows you to set nine levels of security permissions, maybe this is enough for some companies but over the years we have seen higher demand for a deeper level of granularity. This is the case in SAP BusinessObjects where you can go as granular as you want, with 100 permissions!
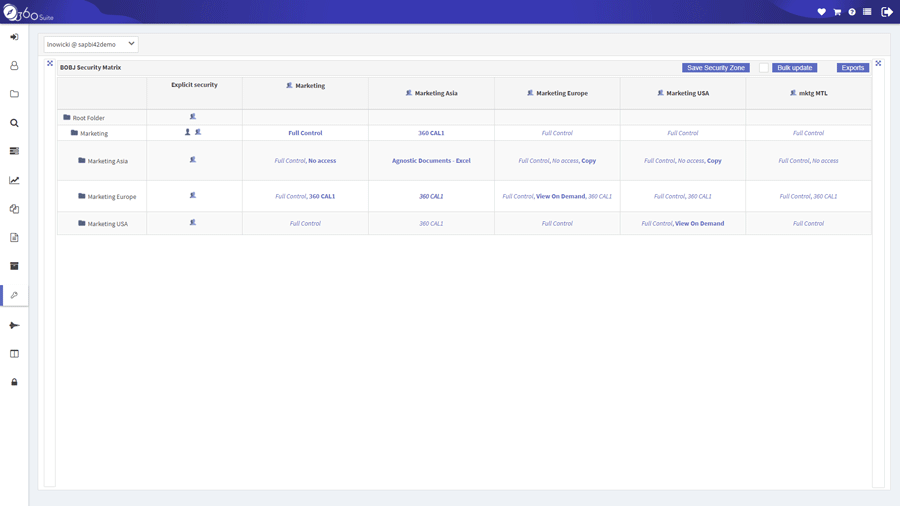
SAP BusinessObject Security Management with 360View
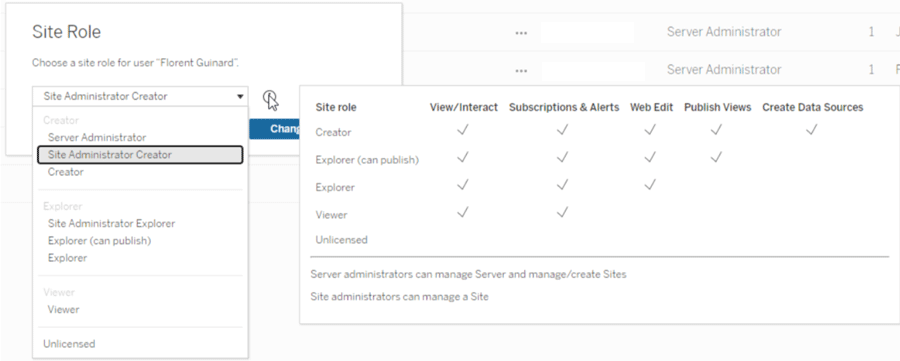
Security permissions in Tableau
Reporting
The key here is to understand how you want your users to use the data. As we all know BOBJ is very strong at operational reporting, it was the solution that made BI reporting accessible to everyone. The power of BOBJ is that it can do very advanced reports, which in its own rights are as useful as powerful dashboard visualizations. Tableau, however, doesn’t allow you to do advanced reporting; you can create some basic tables but they can’t be customized. Tableau allows you to interact with your data differently and in a more modern way using dashboards — it’s the wrong tool to make reports. The question to ask yourself is: Are you happy doing old-school reporting or do you want to start modernizing how you work with your data?
Data Connectivity
Data connectivity within a BI solution allows you to connect to several different database vendors. BOBJ is good at this, however, Tableau does support a lot more, giving users much more flexibility in connecting to a wide variety of database sources. For example, Snowflake was only made available for SAP BusinessObjects in 2020, yet in Tableau, it has been available for a lot longer. Other database support only available in Tableau includes Google Analytics, Qubole, Anaplan and the list goes on. Tableau certainly wins on this one.
Scheduling & Bursting
If we did a direct comparison of report scheduling and bursting between Tableau and SAP BusinessObjects then we would probably conclude that Tableau is rather poor at it. However, these two solutions don’t have the same approach. Tableau is an interactive type of analytics solution where users come to consume the data. BOBJ on the other hand is a reporting solution where corporate reports are made, maintained, and sent to end-users, but, we are now seeing Tableau starting to catch-up. From Tableau Server release 2019.3, users can now carry out report bursting with their PDF subscriptions. That being said, it is still incredibly limited in features, export formats, and bursting, and is not at all at the same level as the capabilities in SAP BusinessObjects. We have to just keep in mind that they’re two different types of BI solutions.
Round one over and it seems SAP BusinessObjects has taken the lead, but could this all change in round two?
Have an SAP BusinessObjects project?

Dashboarding
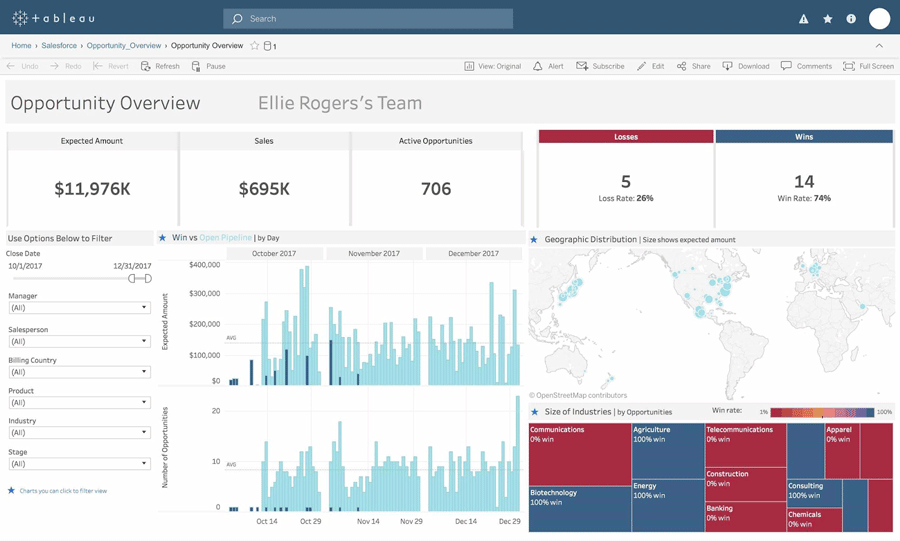
Tableau wins hands down on dashboarding — a great start to round two for this solution! By looking at the two dashboards below, the Tableau one is a lot more advanced. It’s free-flowing, you can drag and drop the tiles with KPIs, you can interact with the dashboard any way you like, you get an advanced map of the world even down to the street view, you get many more customizable chart types — all in all, Tableau dashboards allow for a lot more data interaction and exploration.
WebI on the other hand is limited and the example below is the best you’ll get. The best map is an offline one in the WebI engine only displaying cities with 100,000 + people, to position the blocks as displayed you have to go into five sub-options — it would take approximately one hour to produce this dashboard and this is by following a script with the data already prepared.
SAP BusinessObjects Dashboard
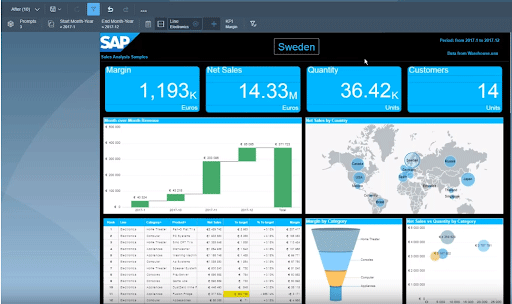
Tableau Dashboard
Interaction & Exploration
For data interaction and exploration, Tableau wins again. It allows you to really dip deep into your data. With your dashboard, you can highlight areas, charts update themselves, and you can zoom in on maps just like you do on Google Maps. It allows you to easily find patterns using images instead of trying to find them in a 100-line report. The visualizations you can create is what modern BI is all about. Take this example of a scatter plot:
WebI Scatter Plot
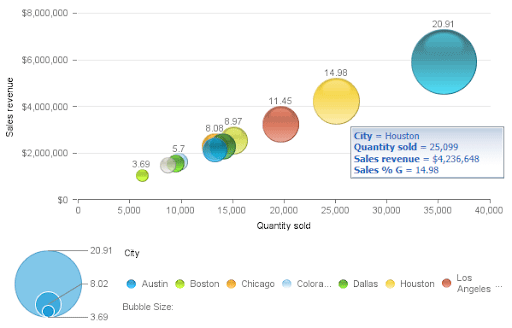
Tableau Scatter Plot
The scatter plot in Tableau comes with predictive features and allows you to find patterns and makes you question the data, for example, why is that green dot outside of the linear pattern of dots? This type of chart takes seconds to build; you plug your data, you drag and drop, and voilà! It allows you to find the problems quickly and easily. This isn’t the case in WebI — the scatter chart is more of a bubble chart, you can’t find the anomalies making it harder to analyze any trends. It’s a different way of presenting the data and would be the type of chart you’d find in a report.
Mapping
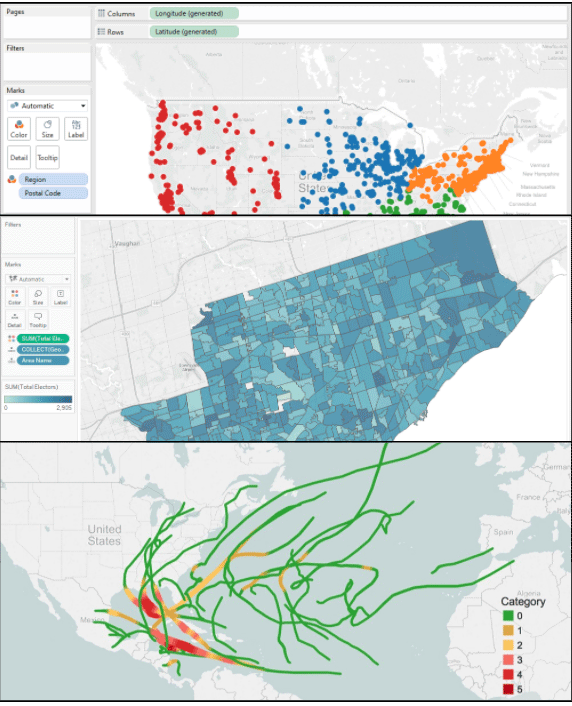
It comes as no surprise who wins this, Tableau! Tableau allows you to build very advanced maps with different KPIs, measures and can go down to extremely low details, such as the street level. For example, the third map on the right-hand side is a map of a hurricane, using GPS coordinates to display when it started and when it got more dangerous as seen in the parts in red. However, with WebI that’s the best you’re going to get; an uninteresting map with pie charts (and we all know my opinion on pie charts 😉 ).
WebI Maps
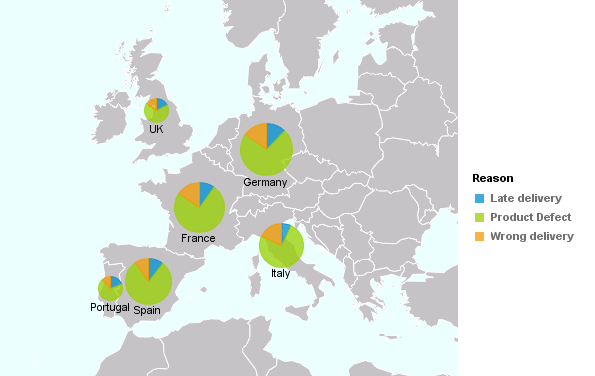
Tableau Maps
Mobile
Both SAP BusinessObjects and Tableau have mobile support but BOBJ is a little behind on this (another blow for SAP BusinessObjects). Sometimes it works for your data and other times it doesn’t. Tableau however has very strong mobile support — it is 100% identical on mobile as it on desktop. Tableau mobile is just an extension of your browser making it far more advanced.
Round two over! Tableau came back in force and secured the win. It’s 1-1 now, who will win the deciding round?
Have a Tableau project?

Training
Training is important for any BI solution that you use. For SAP BusinessObjects, I’d say for WebI it’s fairly easy to learn how it works but the difficulty increases when it comes to Universes. Although BI 4.3 introduces a newer, more modern interface, it can also be a bit of a pain to migrate to for some users. When starting out with Tableau, it is a learning curve to create the visualizations and it does require some harder skills for the Tableau Prep Builder.
License Model & Pricing
The license models between BOBJ and Tableau are very different. Tableau for example is on a subscription model and quite cheap in comparison. There are different models depending on what type of users you have, for example, Viewer (those who simply consume the data), Explorer (those who create dashboards on top of data sources), or Creator (those who create the data sources for others). BOBJ on the other hand is deployed on-premise and requires a perpetual license making it less flexible for potential users. There are also maintenance costs with BOBJ but not with Tableau.
Round 3 Over And The Winner Is…
So, what’s the verdict? The battle saw highs and lows for both solutions but who gets the overall belt? SAP BusinessObjects or Tableau? I won’t deny that I love Tableau and I think it’s a fantastic solution but I also understand why SAP BusinessObjects is still widely used today. It’s a great BI reporting solution and suits those who like to do classic reporting. However, times change and business users look for smarter ways to work with their data. We believe that every company has space for both; operational reporting and scheduling with BOBJ, and nice, modern dashboards and data exploration with Tableau. If it allows us to make better business decisions then perhaps it is worth considering moving to a hybrid model that combines the best of both worlds.